Monitor MikroTik via SNMP
Ask any network admin what they wish they'd watched sooner on a RouterOS box, and the answer is usually the same: the interface that quietly saturated, or the CPU that crept up until packets started dropping. SNMP MikroTik monitoring fixes that by letting you poll the router for those numbers on a schedule, from a distance, without ever opening a Winbox session. RouterOS ships an SNMP agent built in — you just switch it on. This page shows what to enable, which OIDs actually matter on this hardware, and why reading them from outside the box is the part that saves you.
SNMP support on MikroTik
Yes, MikroTik speaks SNMP, and it has for a very long time. Every RouterOS device — from a cheap hEX up to a CCR carrying a full BGP table — carries an SNMP agent as part of the base system. There's nothing to install and no package to add. The service simply ships disabled, so out of the box the router answers nothing until you turn it on.
RouterOS supports SNMPv1, SNMPv2c, and SNMPv3. For most read-only polling you'll want v2c: it's simple, it's fast, and it's what the majority of collectors expect. The catch is that a v2c community string travels across the wire in clear text, exactly as described for SNMP versions generally. If the management path crosses anything you don't fully trust, step up to v3, which adds authentication and encryption. RouterOS lets you define v3 users with SHA auth and AES privacy right in the same configuration menu.
One thing that trips people up: enabling SNMP and reaching it are two different jobs. RouterOS has a firewall, and the input chain will happily drop UDP 161 unless you allow it from your poller. So the mental model is three parts — turn the agent on, define who may read it, and make sure the firewall lets that traffic through. Miss the last step and your walk just times out, looking for all the world like the feature never enabled. It's the single most common reason a "working" MikroTik config appears dead to a collector.
Worth flagging too: RouterOS versions have shifted the SNMP menu around over the years, and the default community behaves differently across releases. Rather than assume, check what's actually there with /snmp print and /snmp community print, then build from what you see. On the interface side you're dealing with the same indexed tables every managed device exposes, so map each interface name to its index once and your graphs stay readable.
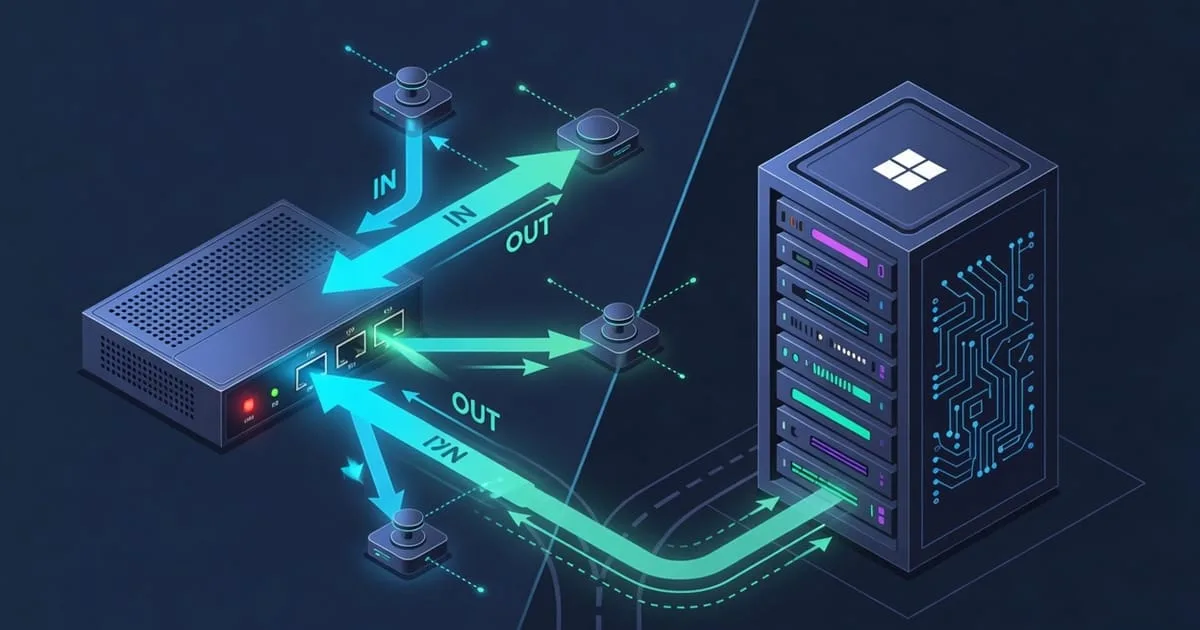
What you can monitor on MikroTik
The most valuable readings on a router are about traffic and reachability, and those live in the standard IF-MIB (RFC 2863) — the same interface tables every managed switch and router exposes. That's good news, because it means your existing tooling already understands them. Per-interface counters come from ifTable at 1.3.6.1.2.1.2.2.1, and the 64-bit high-capacity versions — the ones you want on gigabit links, because the 32-bit counters wrap far too fast — live in ifXTable at 1.3.6.1.2.1.31.1.1.1.
| Metric | OID | Source MIB |
|---|---|---|
| Bytes in (per interface) | 1.3.6.1.2.1.2.2.1.10 (ifInOctets) | IF-MIB (RFC 2863) |
| Bytes out (per interface) | 1.3.6.1.2.1.2.2.1.16 (ifOutOctets) | IF-MIB (RFC 2863) |
| Interface up/down | 1.3.6.1.2.1.2.2.1.8 (ifOperStatus) | IF-MIB (RFC 2863) |
| Nominal link speed | 1.3.6.1.2.1.2.2.1.5 (ifSpeed) | IF-MIB (RFC 2863) |
| 64-bit bytes in | 1.3.6.1.2.1.31.1.1.1.6 (ifHCInOctets) | IF-MIB (RFC 2863) |
| 64-bit bytes out | 1.3.6.1.2.1.31.1.1.1.10 (ifHCOutOctets) | IF-MIB (RFC 2863) |
| System uptime | 1.3.6.1.2.1.25.1.1.0 (hrSystemUptime) | Host Resources MIB (RFC 2790) |
Beyond interfaces, RouterOS also publishes device health — CPU load, board temperature on models that have a sensor, voltage, fan RPM — but those live in MikroTik's own vendor MIB (MIKROTIK-MIB), not in a public RFC. The exact numeric OIDs vary by hardware and firmware, so the honest advice is to load the vendor MIB from MikroTik and walk the tree on your specific model rather than trust a number copied off a forum. For the interface side you're on solid, standards-based ground. If you want the deeper treatment of what those counters mean, the interface traffic and interface status pages own that topic.
Here's the split at a glance, so you know which tree to walk on a RouterOS box:
- Per-interface bytes, packets, up/down, speed — standard IF-MIB, works with any SNMP tool.
- System uptime — Host Resources MIB, standard.
- CPU load, board temperature, voltage, fan RPM — MIKROTIK-MIB (vendor), OIDs vary by model and firmware.
- Wireless registrations and signal (on wireless models) — vendor MIB only; consult the MikroTik MIB export.
Enabling SNMP — steps
RouterOS configuration happens in its own CLI (or the equivalent Winbox menus). Here's the shortest safe path to a read-only agent:
- Turn the service on and set contact/location so the device identifies itself:
/snmp set enabled=yes contact="netops" location="rack-3" - Create a read-only community locked to the subnet your poller lives on — never leave it wide open:
/snmp community add name=<community> addresses=10.0.0.0/24 read-access=yes write-access=no - Bind that community as the one the agent uses:
/snmp set enabled=yes - Allow the poller through the firewall so UDP 161 actually reaches the agent:
/ip firewall filter add chain=input protocol=udp dst-port=161 src-address=10.0.0.0/24 action=accept - Verify from your workstation with a Net-SNMP walk of the interface table:
snmpwalk -v2c -c <community> 10.0.0.1 1.3.6.1.2.1.2.2.1
A few habits keep this tidy. Pick a long random string for the community — treat it as a password, not a label. Scope the addresses= field and the firewall rule to your management network, so a random host on the internet can't scrape your router. And if the link is exposed at all, define an SNMPv3 user instead of a community. Changing away from the default port is another sensible hardening move; the custom port guide covers the trade-offs, and the wider setup section covers the poller side.
Monitoring it externally
Enabling the agent is half the story. The other half is where you poll it from. A collector sitting inside the same rack, on the same power feed and the same upstream link as the MikroTik, shares that router's fate — when the site drops, so does your visibility, right when you most need it. That blind spot is the whole argument for double durability: watch the device from somewhere it doesn't depend on.
This is where ostr.io Monitoring fits the RouterOS use case cleanly. It polls your MikroTik's SNMP agent from outside your network — no extra software on the device, just the agent you already enabled — and fires real-time email and SMS alerts when an interface goes down or a threshold trips. Because the check originates externally, a full site outage still reaches you. Point it at your public monitoring endpoint and you get an independent second opinion that the router itself can never give you about its own downtime.